Validity, Reliability, and Fairness
Validity
The validity of a measure indicates to what extent items measure some aspect of what they are supposed to measure.
Content validity:
- The instrument addresses the learning outcomes
- There is a match between the assignment and the rubric
- Rubric scores can be applied to the learning outcomes, and indicate the degree of student achievement within the program or a course.
Reliability
The reliability of a measure indicates the degree to which an instrument consistently measures a particular skill, knowledge.
Reliability of the instrument:
Refers to the consistency of the response or the scores obtained by an individual in a test or research instrument administered twice.
Fairness
Fairness in assessment must take into account the fact that irrelevant factors, such as experience or family background may affect the scores of certain students.
Be sensitive to potential unfairness or bias in the measures selected for assessment.
Data Collection Process
The data collection process consists of three basic steps:
Step 1: Gathering Data
Step 2: Analyzing Data
Step 3: Storing Data
Analyzing Data
Analyzing data is important to get a sense on how students performed against each outcome. Analysis is a process that provides a better understanding of data and allows inferences to be made. It allows you to summarize the data to enhance the value of the information gathered and provides direction for decisions regarding course and program improvement. While data analysis can be relatively complex, for the purpose of assessment it is usually basic. This section discusses the core elements of data analysis and provides strategies for and examples of analysis. The underlying theme of this section is to illustrate how to link data to the learning outcomes and provide a basis for using data to improve student learning.

Before Analyzing Data
You should review data visually. Make sure that your data set includes results from all sections of the course (if applicable). Reviewing data has two benefits:
- It allows for the identification of outliers and possible mistakes
- it enables basic patterns or trends to emerge. For example, it may be clear that all students had difficulty with a particular outcome.
Analyzing Assessment Data
Once the data have been reviewed and aggregated (if applicable), the process of analyzing data follows. Assessment’s focus on student achievement of learning outcomes typically requires the determination of counts and percentages. Together they show clearly the number of students involved in the activity and the rate of successful display of the outcome.
All data, regardless of type can be analyzed using counts and percentages. Numeric data has the additional benefit of being able to be analyzed using descriptive statistics. Mean, median, and mode provide useful information to interpret data by allowing for easier comparison between groups and tests for significant differences.
Presenting Data
Tables and graphs are useful in presenting analysis because they focus attention to specific results.
Tables are useful for
- reporting multiple percentages and frequencies
- comparison of student performance over time
- some descriptive statistics.
They provide an ordered way for readers to see results quickly for each outcome measure without having to search through text to find a particular result. Graphical representations of results show differences in variables, which makes graph highly effective in showcasing assessment results.
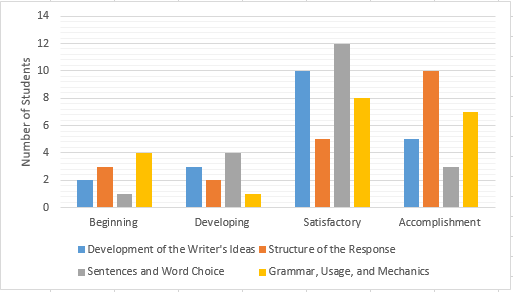
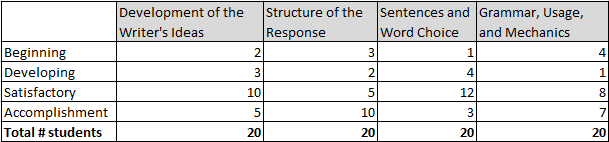
The example in table and graph above: Example of table of counts shows data collected from 20 student essays for one learning outcome. It indicates the number of students who score at each performance standard.
When sharing the results of course/program assessment it may be useful to report each learning outcome and outcome measure paired with the corresponding results of the analyses, which joins the multiple outcome measures for each learning outcome.
Next, compare the results with the specified performance standard and discuss the implications of the data as they relate to the course or program. Both strengths and areas for improvement are discussed, because showcasing course and program success is just as important as identifying areas for improvement, when it comes to making data based decisions about the program. When comparing student performance to specified performance standards, a table with the counts and percentages may be useful to summarize the data.
Supplemental Materials
This page is licensed under a Creative Commons Attribution-Noncommercial 4.0 International License.
Collecting and Analyzing Data Assessment for Registered Faculty
If you are a registered Assessment Bootcamp faculty member, complete the Collecting and Analyzing Data Assessment before proceeding to Improvement to Curriculum and Instruction.
Assessment Bootcamp
Once data has been collected and analyzed, changes to curriculum and instruction can be implemented to improve student learning.